Site Health Score
A health score for each Site, built from device status, data gaps and open alerts, with the limits that are coming up.
Health scores for every Site, a trend forecast that warns before a limit is reached, Work Orders that follow alerts to the fix, and KPIs and environmental figures from the same data.

An alert says something is wrong now. Health, forecasts and Work Orders cover the time before and after: which limits are coming up, who is fixing what, and whether the plant ran better this month than last.
A health score for each Site, built from device status, data gaps and open alerts, with the limits that are coming up.
A projection of up to 90 days on the Node page shows when a value is on course to cross its limit.
Create a Work Order from an alert or a Rule, assign it, track it to done, with reminders when it is overdue.
Production, energy, fuel and stop reasons per Site, turned into the KPIs your managers report.
PM10 and PM2.5 against MAAQS 2020, and CO2e estimates from Energy Commission grid factors and IPCC fuel factors. Estimates, not legal advice.
Summary, consumption, data availability, alert, KPI and environmental reports as A4 PDF or CSV, by hour, day or week.
Download all of a company's data as one archive at any time. A closed company keeps its data.
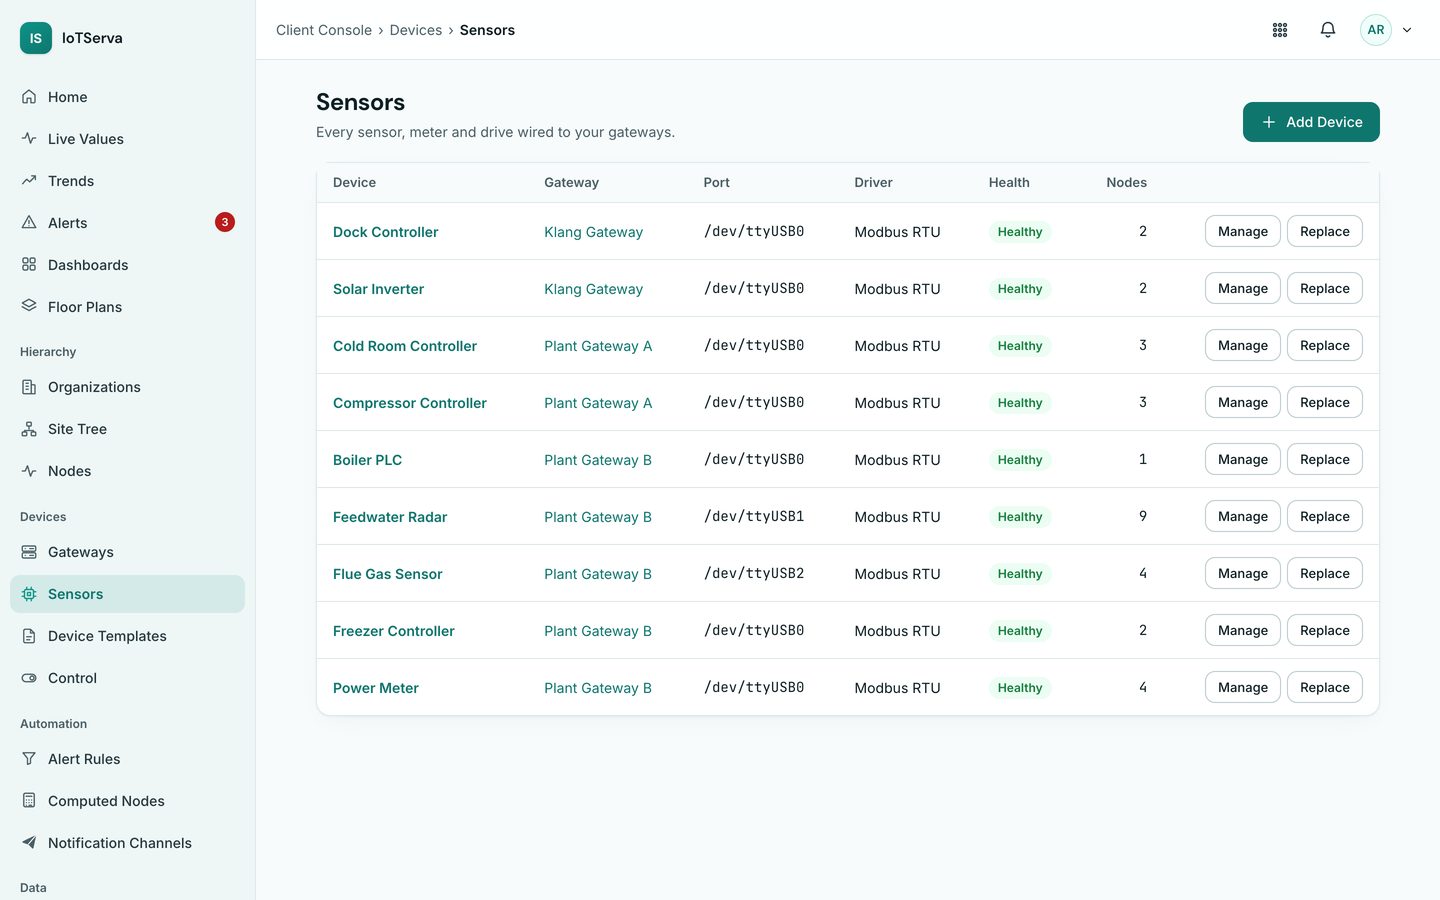
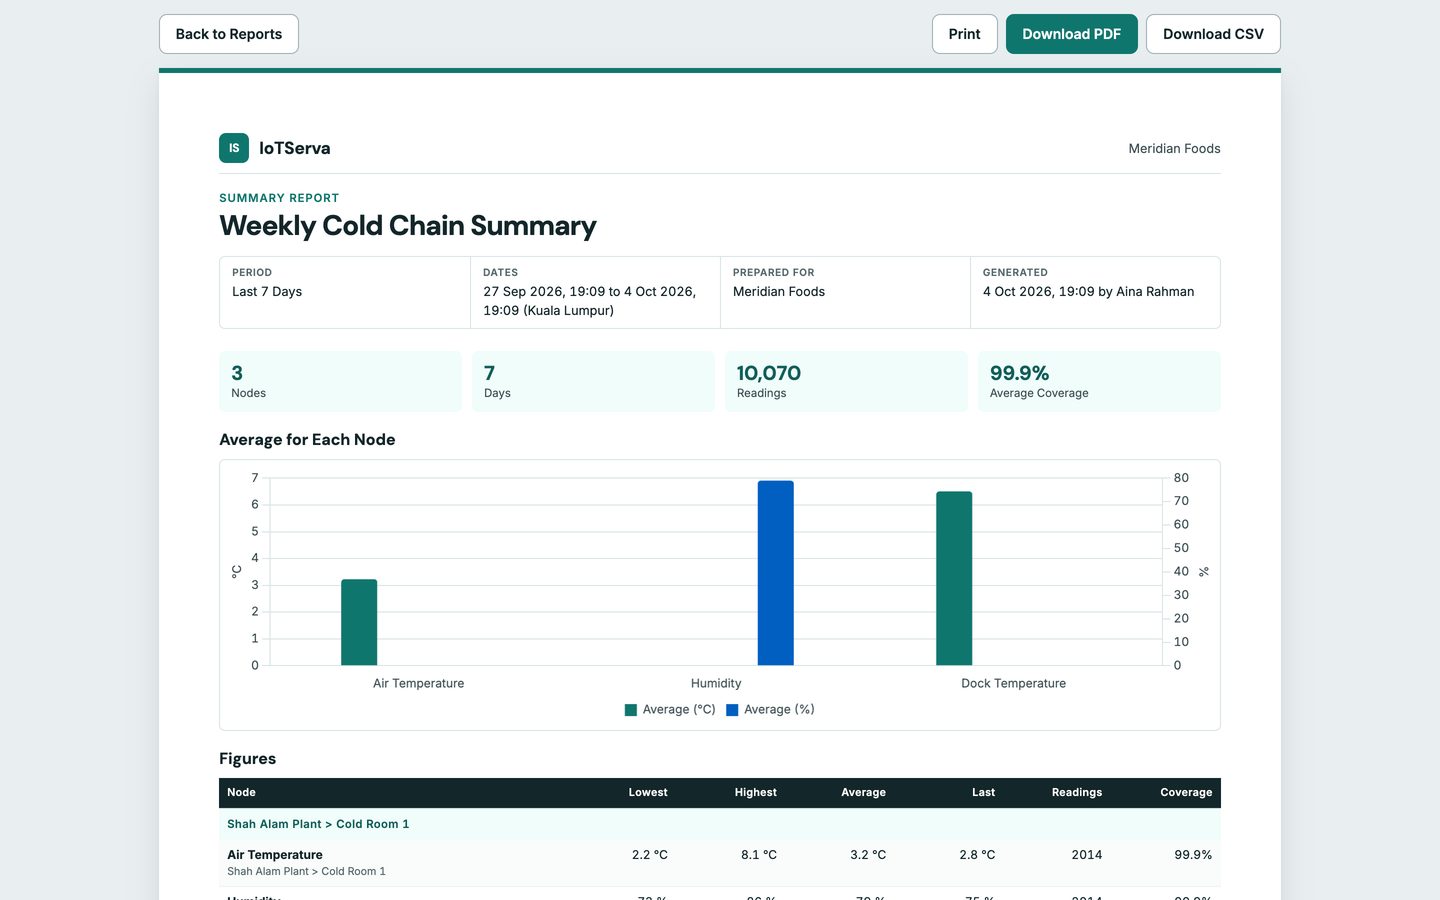
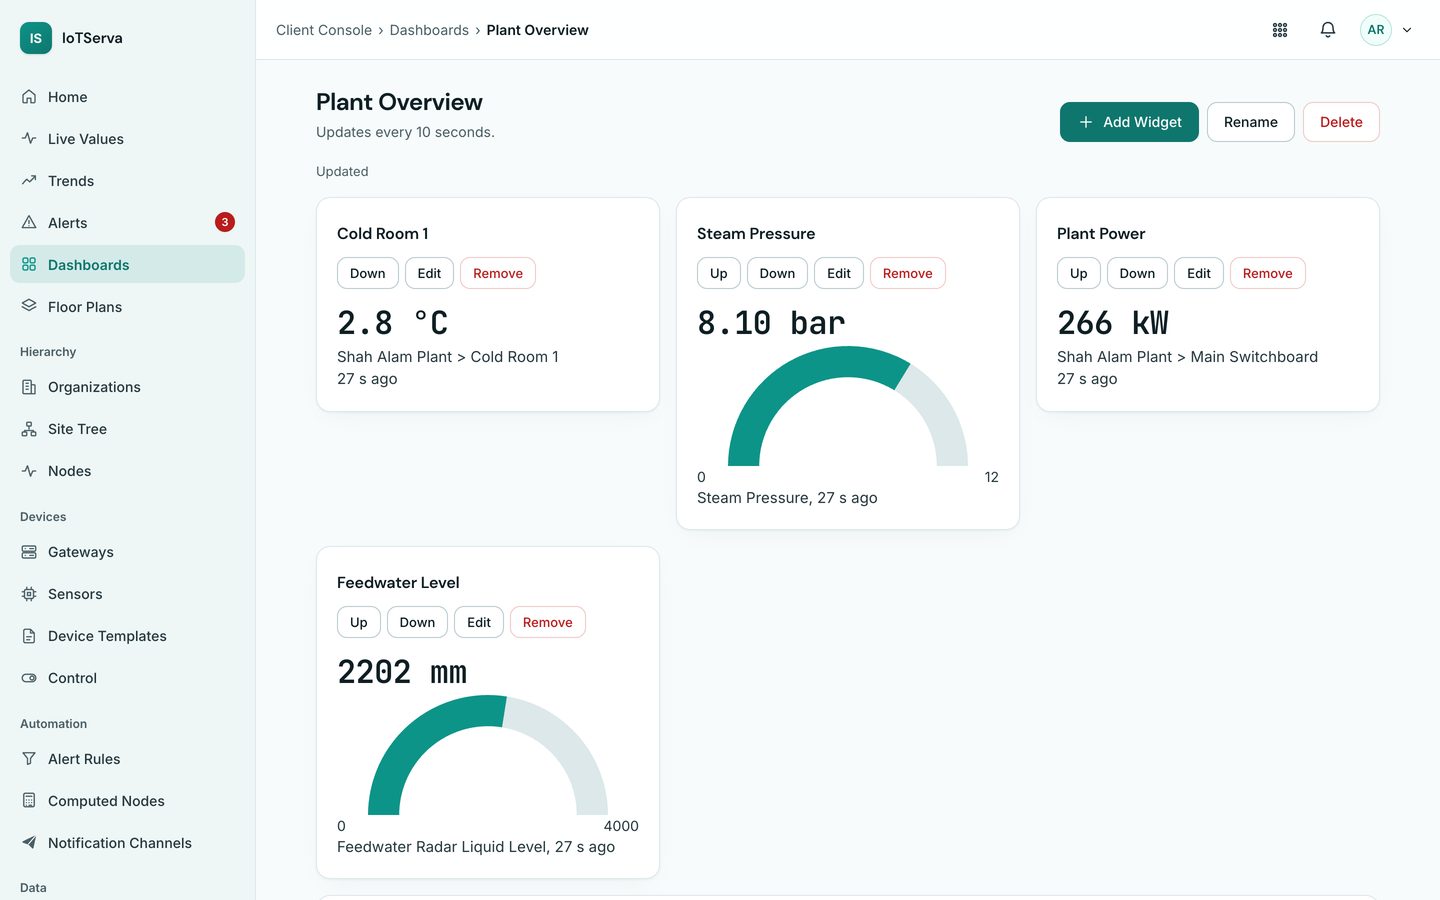
Screens from the live IoTServa software with a demo company and demo data.
No. They are estimates against published reference values that administrators can update, to support your own reporting.
Up to 90 days, and only when there is enough history for a meaningful trend.
See VYROX Hardware or Read the Protocol Guides
Tell us which protocols are on site. We will scope a pilot that reads your real devices.